
Figure 2.
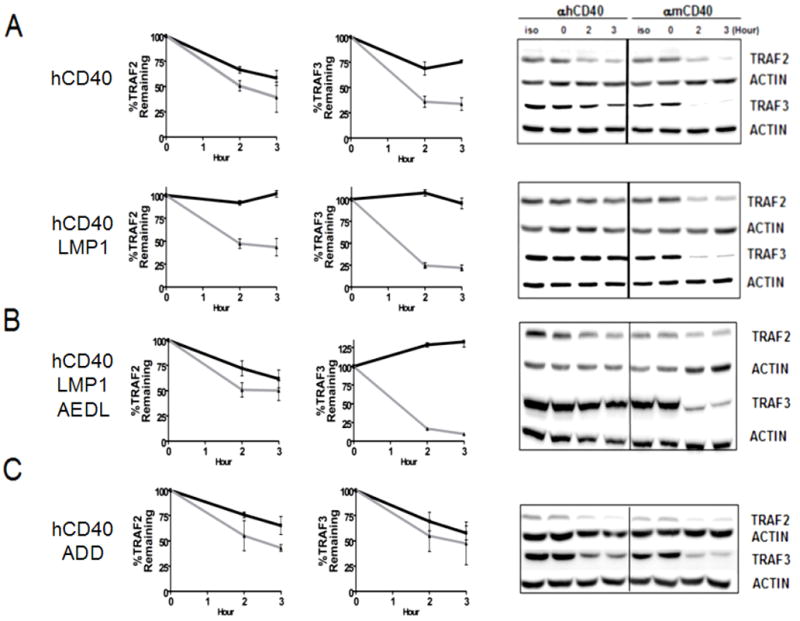
Differential abilities of hCD40, hCD40LMP1, hCD40ADD, and hCD40LMP1AEDL CY domains to induce TRAF degradation. Whole cell lysates from M12.4.1 B cells transfected with hCD40 or hCD40LMP1 (A), hCD40LMP1AEDL (B) or hCD40ADD (C) and stimulated with isotype control Ab, anti-mCD40 Ab, or anti-hCD40 Ab were analyzed for TRAF2 and TRAF3 degradation. Quantification of TRAFs (A–C) was performed by measuring the intensities of TRAF2, TRAF3, and actin bands as in Methods. The amount of each TRAF band was normalized to the corresponding actin band. These values were then normalized to the 0 hour time, which was set as 100% of either TRAF2 or TRAF3. Black solid lines represent TRAF degradation induced by hCD40 agonistic mAb, grey lines represent TRAF degradation induced by anti-mCD40 agonistic mAb, and serves as an endogenous control for each transfected subclone. Data shown are representative of three or more experiments performed with two or more clones of each transfectant.