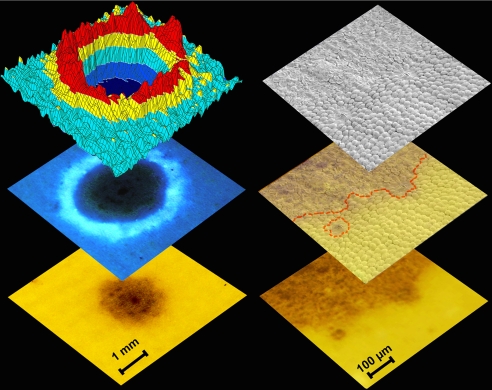
Fig. 6.
Hypermodified FCCs—endogenous molecular tools for analysis of senescence. Enlarged images of areas of a dark spot and its surroundings (Left, Bottom, and Center) and luminescence map (false colors, spatial resolution 0.5 mm) (Left, Top). Surface structure of boundary region of a dark spot from SEM analysis (Right, Top), stereo microscope image of the same area (Right, Bottom) and overlay of the two representations (red dotted line, rough trace of the local transition of still turgescent to dead cells).

