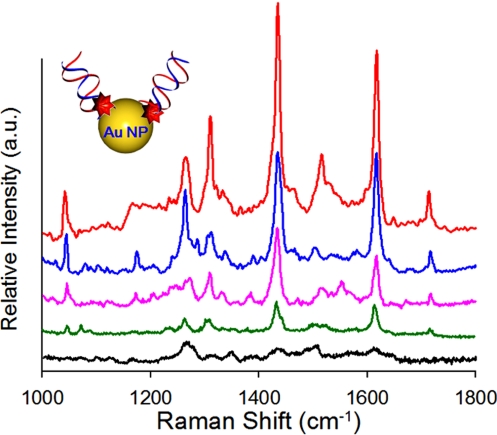
Fig. 6.
SERS spectra of 3 nM Cy3-labeled DENV-4a. After introducing the 60-nm Au colloid solution by applying electric field of 40 V cm-1, the SERS emission at the interface between nanochannels and microchannel was monitored as a function of time: (1) 5 s, (2) 10 s, (3) 20 s, (4) 40 s, and (5) 60 s. As expected, the intensity of the signal increases with the accumulation and aggregation of SERS emitters.

