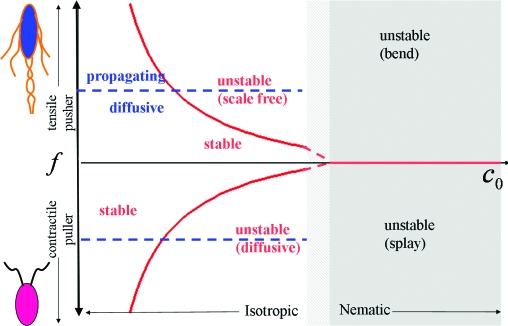
Fig. 3.
A “phase diagram” for active suspensions. The vertical axis is the active force f, with f > 0 for pushers and f < 0 for pullers. The horizontal axis is the mean concentration, c0. The red lines mark the onset of the instability of the homogeneous states, which is scale-free for pushers and diffusive for pullers. The ordered state is unstable for all f. A transition from the isotropic to the nematic state is expected to occur in the shaded region, which is not accessible to the present theory. Swimmers (but not shakers) also exhibit propagating (sound-like) density waves above a threshold value of |f| indicated by the horizontal dashed blue line.

