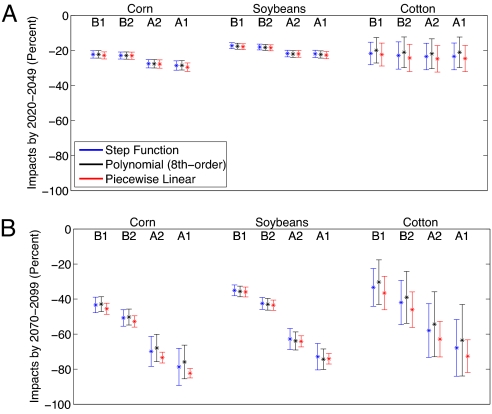
Fig. 2.
Predicted climate-change impacts on crop yields under the Hadley III climate model. Graphs display predicted percentage changes in crop yields under four emissions scenarios. Frame A displays predicted impacts in the medium term (2020–2049) and frame B shows the long term (2070–2099). A star indicates the point estimates, and whiskers show the 95% confidence interval after adjusting for spatial correlation. The color corresponds to the regression models in Fig. 1.

