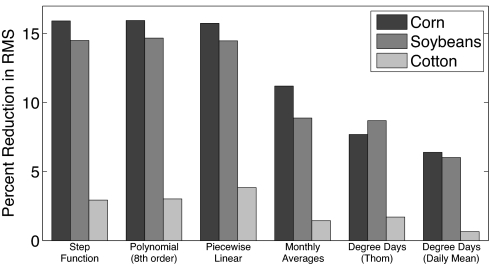
Fig. 3.
Out-of-sample prediction comparison for various model specifications. Bar charts display the percent reduction in the root-mean-squared prediction error (RMS) for each model in comparison with a baseline model with no weather variable. Each model is estimated 1,000 times, where each replication randomly selects 48 of the 56 years in our full sample. Relative performance is measured according to the accuracy of each model's prediction for the omitted eight years of the sample (≈14%). We sample years instead of observations because year-to-year weather fluctuations are random, but there is considerable spatial correlation across counties within each year. Step function, polynomial (eighth order), and piecewise linear are the models developed in this paper; the other models are from the existing literature.

