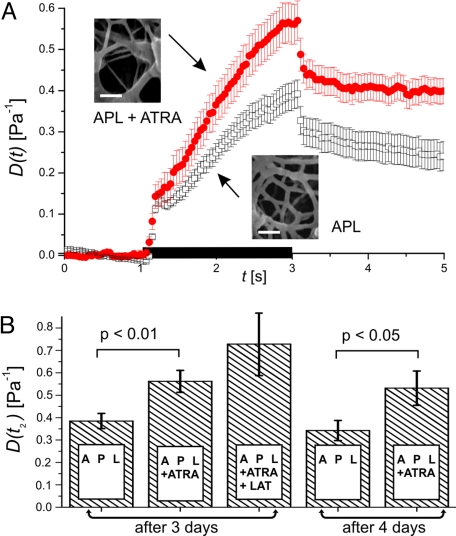
Fig. 2.
Change of APL cell compliance in response to ATRA. (A) ATRA differentiated APL cells (filled circles; n = 44) are significantly more compliant than controls (open squares; n = 42), mean ± SEM. The black bar on the time axis indicates the application of stress. Insets depict electron microscopy images of the subcortical actin filament network. (Scale bars, 100 nm.) (B) Deformability at the end of stress application, mean ± SEM. There was no significant difference between APL cells exposed to ATRA for 3 and 4 days. A higher deformability could be measured after depolymerizing F-actin with latrunculin A (LAT).

