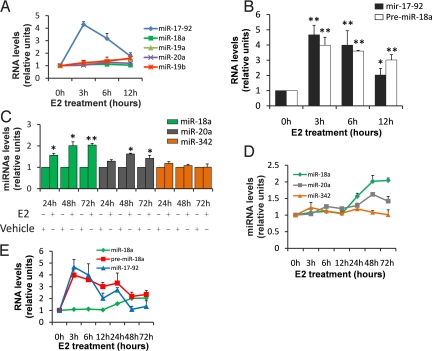
Fig. 3.
Pri-mir-17–92 is negatively regulated following DROSHA cleavage prolonging miRNA maturation over time. (A) Comparison of the levels of expression between pri-mir-17–92 (normalized to GAPDH) and miRNAs encoded from this cluster (normalized to U47). The mean of 3 experiments each performed in triplicate are presented, error bars represent SEM. (B) After starvation expression levels of both pri-mir-17–92 and pre-miR-18a has been analyzed by RT-qPCR using SYBR green and normalized to U6 snRNA followed E2 treatment as indicated. The mean of 3 experiments each performed in triplicate are presented, error bars represent SEM. The asterisk indicates P < 0.05 in comparison to time 0 h, the double asterisk represents P < 0.005 in comparison to time 0 h. P values were obtained using a 2-tailed Student's t-test. (C) After starvation expression levels of miR-18a, miR-20a, and miR-342 were analyzed by RT-qPCR and normalized to U47 snRNA. The mean of 3 experiments each performed in triplicate are presented, error bars represent SEM. The asterisk indicates P < 0.05 in comparison to vehicle treatment, the double asterisk represents P < 0.005 in comparison to vehicle treatment. P values were obtained using a 2-tailed Student's t-test. (D) Representation of miR-18a, miR-20a, and miR-342 levels (normalization to U47 snoRNA) from 0 to 72 h of E2 treatment by RT-qPCR. The mean of 3 experiments each performed in triplicate are presented, error bars represent SEM. (E) Representation of the miR-18a (normalization to U47), pre-miR-18a and pri-mir-17–92 levels (normalization to U6) from 0 to 72 h of E2 treatment. The mean of 3 experiments each performed in triplicate are presented, error bars represent SEM.

