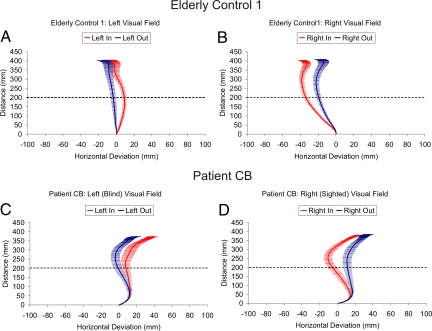
Fig. 3.
Averaged spatial trajectories for the real-time obstacle avoidance experiment. Depicts averaged movement trajectories (± standard error) for EC1 (Top) and patient CB (Bottom) as a function of obstacle position (i.e., in vs. out) and left vs. right visual field for the single object trials. The x-axis depicts horizontal deviation in millimeters (mm), and the y-axis depicts reach distance in millimeters. Note that the x-axis has been magnified to illustrate the separation between trajectories. The dotted line represents the depth at which the obstacles were located (35 cm) from the reach start position (15 cm; i.e., 35 cm − 15 cm = 20 cm). Positive values refer to the right of midline, whereas negative values refer to left of midline. Note that patient CB's reaches were always directed to the right side of the target strip, the only part of the strip that he could see. Nevertheless, his reach trajectories were significantly influenced by the position of the obstacles in his blind field (see also Figs. S6 and S7).

