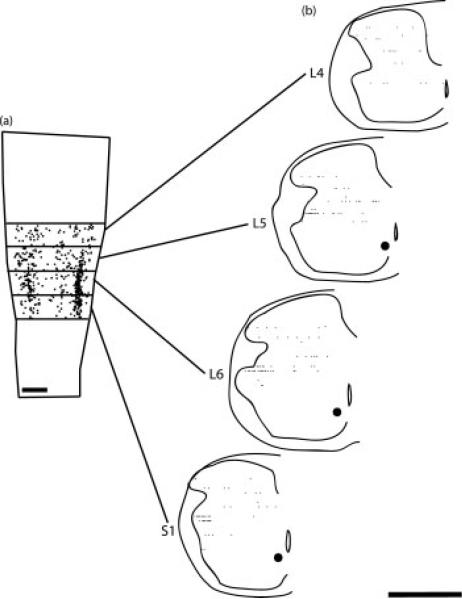
Figure 4.
(a) Computer-generated composite indicating the location of Fos-positive cells in the area of the SNB dendritic field following stroking of the perineum, drawn at 40-μm intervals through the entire dorsoventral extent of the labeling. (b) Reconstructions of spinal cord hemisections in the transverse plane from multiple horizontal sections showing the distribution of Fos-labeled cells in the dorsal horn at the L4 through S1 segment levels. Transverse reconstructions were made at 500-μm intervals as indicated in (a). Scale bars = 500 μm.

