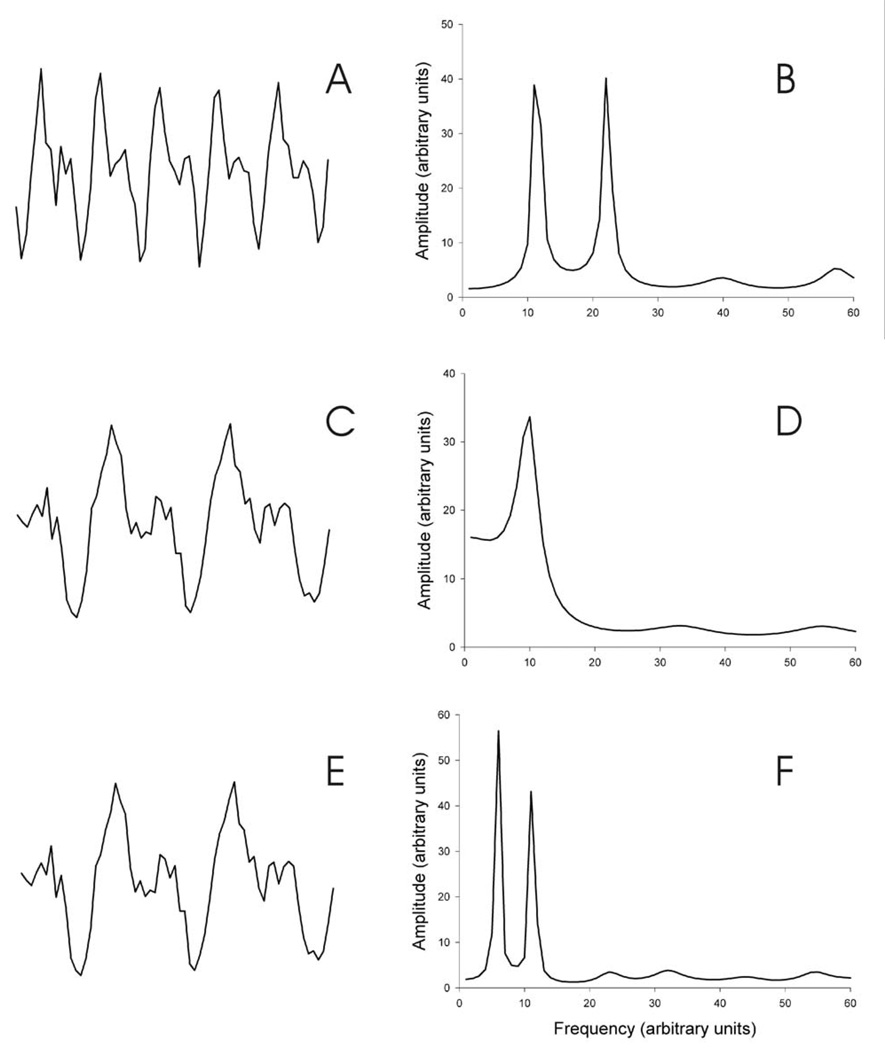
Figure 1.
Simulated waveforms and their corresponding spectra. A. B. Spectrum of A derived by an 8th order autoregressive model. C. A 64-sample waveform comprised of two sine waves with periods of 12 and 24 samples and added noise. D. Spectrum of C derived by an 8th order autoregressive model. E. Same as C. F. Spectrum of E derived by a 16th order autoregressive model. Note that the same sine wave with a period of 6 samples was resolved by an 8th order model when it was added to another sine wave with a period of 6 samples (B), but not when it was added to a sine wave with a period of 24 samples (D). Resolution of the latter two sine waves was achieved by a 16th order model (F).

