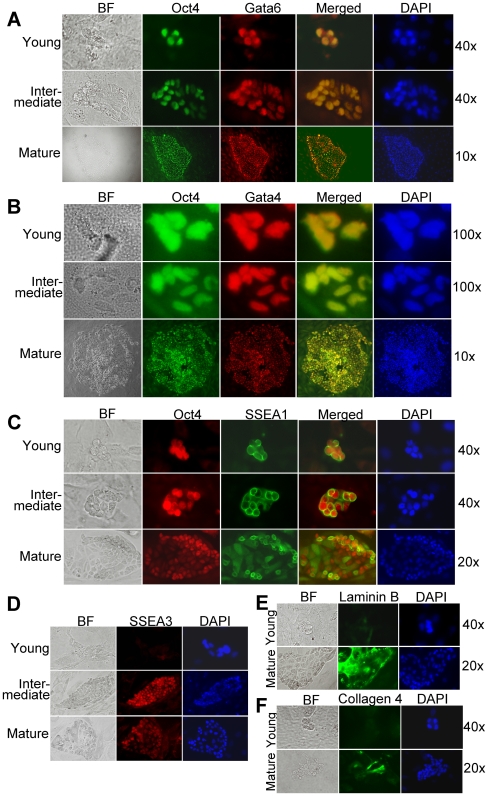
Figure 4. Lineage marker analysis during the evolution of colonies growing after low-density plating of a rat XEN-P cell line (RX1).
(A) Double staining for Oct4 (green) and Gata6 (red); (B) Double staining for Oct4 (green) and Gata4 (red); (C) Double staining for Oct4 (red) and SSEA1 (green); (D) Staining for SSEA3; (E) Staining for Laminin B; (F) Staining for Collagen 4. BF, bright field. RX1 cells were plated at 25–50 cells/cm2, and at different time points, the resulting colonies were stained with the indicated antibodies and counterstained with DAPI. Controls omitting primary antibodies were negative and are not shown. The speed of colony evolution varied somewhat between experiments, resulting in “Young” colonies at days 2–3, “Intermediate” colonies at days 3–5, and “Mature” colonies at days 5–7 (day 0 = day of plating).

