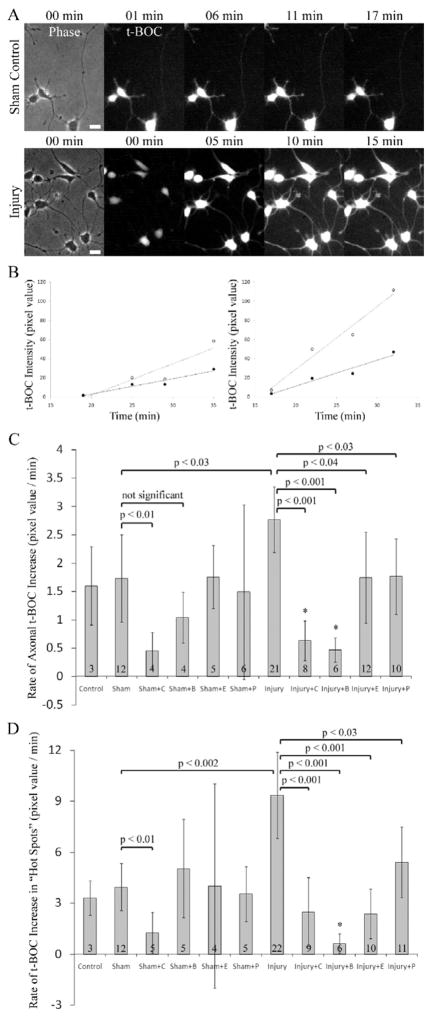
Figure 3.
Injury-induced increase in calpain activity. A. Signal intensity of t-BOC, a specific fluorescent substrate of calpain, increases significantly in the injured neurons compared to sham control. Time indicates the post-injury period. B. t-BOC intensity vs. time plots for the neurons shown in A. In sham controls, there is a gradual increase in the t-BOC signal indicating basal calpain activity. Both for the sham control (left graph) and the injured neuron (right graph) focal peaks (open circles) show a higher rate of increase than the axon average (filled circles). X-axes indicate time after t-BOC addition. C. and D. Calpain activity, measured by the rate of t-BOC signal intensity change, increases significantly in mechanically injured neurons and this increase is blocked by ALLN, BAPTA, EGTA, and post-injury P188 both in the axon and in focal peaks. Control = Incubator controls; C = 3μM ALLN; B = 20μM BAPTA; E = 1mM EGTA; P = 100μM P188. ANOVA is followed by Tukey-Kramer test. *Significantly different from sham controls. Number of neurons analyzed is displayed on bars. Error bars represent 90% confidence intervals.

