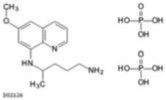
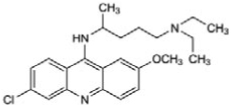
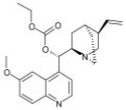
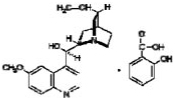
TABLE 1.
Structures of quinoline analogs that inhibit pigmentation and their IC50 values on melanin synthesis in melan-a cells
| Compound | Structure | IC50 |
|---|---|---|
| µM | ||
| Amodiaquine dihydrochloride |

|
2.6 ± 0.15 |
| Chloroquine |

|
0.7 ± 0.18 |
| Cinchonidine |  |
10.9 ± 0.22 |
| Dibucaine hydrochloride |

|
10.2 ± 0.28 |
| Mefloquine hydrochloride |

|
2.0 ± 0.15 |
| Primaquine diphosphate |  |
6.8 ± 0.37 |
| Quinacrine hydrochloride |

|
1.8 ± 0.17 |
| Quinidine |

|
2.7 ± 0.14 |
| Quinine |  |
1.6 ± 0.15 |
| Quinine ethyl carbonate |

|
5.1 ± 0.12 |
| Quinine salicylate |

|
3.6 ± 0.28 |
