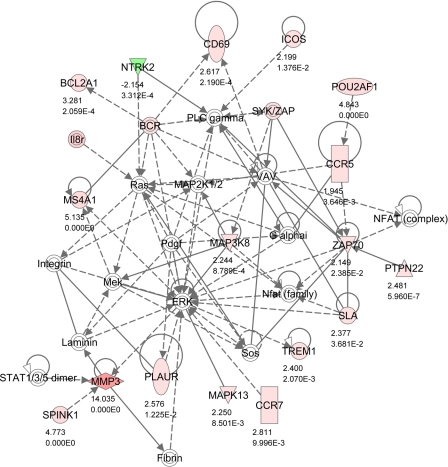
Fig. 4.
IPA Network 3. Differentially regulated genes in endometrium involved in hematological system development and function, humoral immune response, and tissue morphology with 17 focus molecules and a score of 29. The network is displayed graphically as nodes (gene/gene products) and edges (the biological relationship between nodes). The node color intensity indicates the expression of genes: red upregulated, green downregulated in SNEB vs. MNEB endometrium. The fold value and P values are indicated under each node. The shapes of nodes indicate the functional class of the gene product as shown in the key given in Fig. 2. Solid lines indicate a direct interaction, and dotted lines an indirect interaction.

