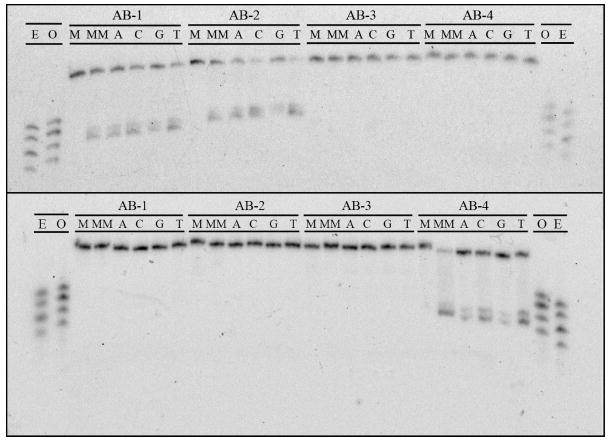
Figure 3.

PAGE assay illustrating the recognition and photocleavage of mismatch and abasic site recognition. Sequence contexts are listed along top line of each gel, and individual duplexes are indicated in the second line (M = matched, MM = mismatched, A = unpaired adenine, C = cytosine, G = guanine, and T = thymine). In the top gel, the single strand beginning 5’-GAC CAG … (that containing the unpaired base in the abasic assemblies) is 5’-32P-labeled. In the bottom gel, the single strand beginning 5’-GAC TTA … (that containing the abasic site) is 5’-32P-labeled. In both experiments, 1 μM duplex was incubated with Rh(bpy)2(chrysi)3+ in 50 mM NaCl, 10 mM NaPi, pH 7.1. Samples were irradiated for 10 min on an Oriel Instruments solar simulator (320-440 nm emission) and incubated for 30 min at 60 °C prior to electrophoresis. “E” and “O” denote lanes containing even (10, 12, 14, 16) and odd (11, 13, 15, 17) standardization fragments.
