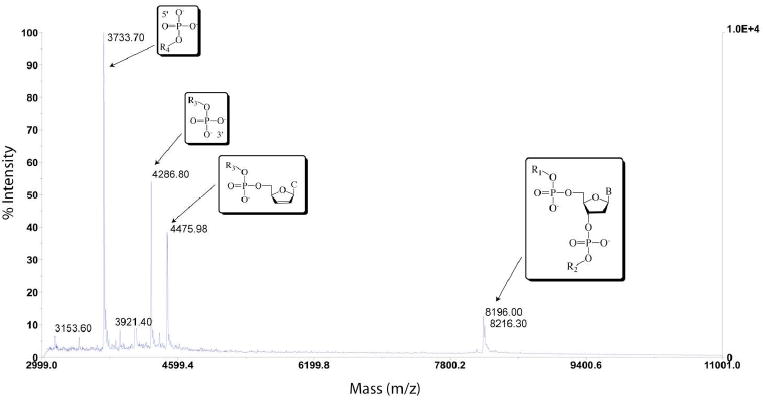
Figure 7.

MALDI-TOF mass spectrograph of photocleavage products of duplex AB1-C, 5’- GAC CAG CTT ATC ACC CCT AGA TAA GCG -3’ in which the underlined, italicized cytosine is the unpaired complement of an abasic site. The rightmost peaks correspond to the full, uncleaved parent strands. Assigned scission products can be viewed on the left-hand side of the plot and correspond to 5’-PO4-CCT AGA TAA GCG-3’, 5’-GAC CAG CCT ATC AC-PO4-3’, and 5’-GAC CAG CCT ATC AC-dehydroC-3’. R1 = GAC CAG CTT ATC A; R2 = CCC TAG ATA AGC G; R3 = GAC CAG CCT ATC AC; R4 = CCT AGA TAA GCG; B = cytosine.
