
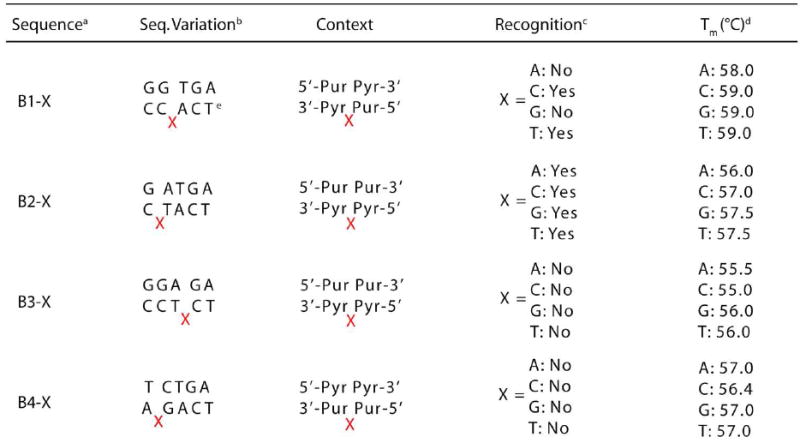
Table 2.
Sequence and recognition information for single base bulge assemblies.
 |
a
Data for the corresponding matched and mismatched strands (e.g.ABI-M and AB1-MM for B1-X) can be found in Table 1.
b
Sequence within variable region of 5’-GACTTATCT AGA/WA/W/WT AAG CTG GTC-3’(top) and complement (bottom). The complementcontains the bulged base.
c
Determined by photocleavage assay employing 5 |iM Rh(bpy)2(chrysi}3+and luM duplex DNAin buffer (50 mM NaCI, 10 mM NaPi.pH 7.1).
d
Determined with UV-Visible spectrophotometry employing 1 (.nVl duplex DNA in buffer. Accurate within 1 °C.
e
X denotes the bulged base.