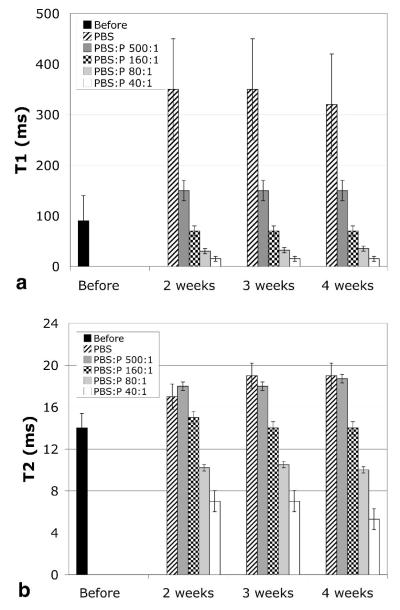
Figure 5.
a) The peak of the T1 histogram of stained E18.5 specimens (N = 3-4) increases during storage for lower concentrations of ProHance (P) and decreases for higher concentrations: T1 (before storage, right after immersion in Bouins:ProHance 20:1 for 5 h) = 90 msec, T1(PBS) = 340 msec, T1(PBS:P 500:1) = 150 msec, T1(PBS:P 160:1) = 70 msec, T1(PBS:P 80:1) = 32 msec, T1(PBS:P 40:1) = 15 msec. T1 remains stable for at least 4 weeks. b) The concentration of ProHance in the storage solution also affects T2: T2(before) = 14 msec, T2(PBS) = 18.3 msec, T2(PBS:P 500:1) = 18.2 msec, T2(PBS:P 160:1) = 14.3 msec, T2(PBS:P 80:1) = 10.2 msec, T2(PBS:P 40:1) = 6.4 msec. T2 remains stable for at least 4 weeks. The bar height (mean) shown in those graphs is the peak in each histogram. The error bars shown are the width of the histograms at half maximum, averaged over the 3–4 histograms, and thus show the spread of the histograms. As the peak of the histograms is reduced, the spread decreases, indicating homogeneous reduction of T1/T2 in all tissues.

