Figure 7.

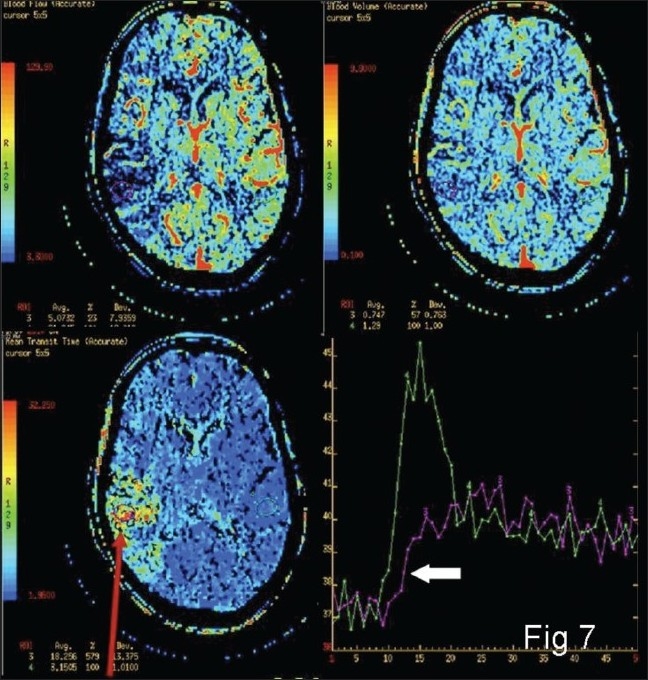
Color-coded maps and time–attenuation curve (bottom right panel) from the umbra (arrow) showing significant reduction in the flow as compared with the normal side (block arrow)

Color-coded maps and time–attenuation curve (bottom right panel) from the umbra (arrow) showing significant reduction in the flow as compared with the normal side (block arrow)