
Figure 4. Neurogenesis occurs around the vessel network in the adult SVZ.
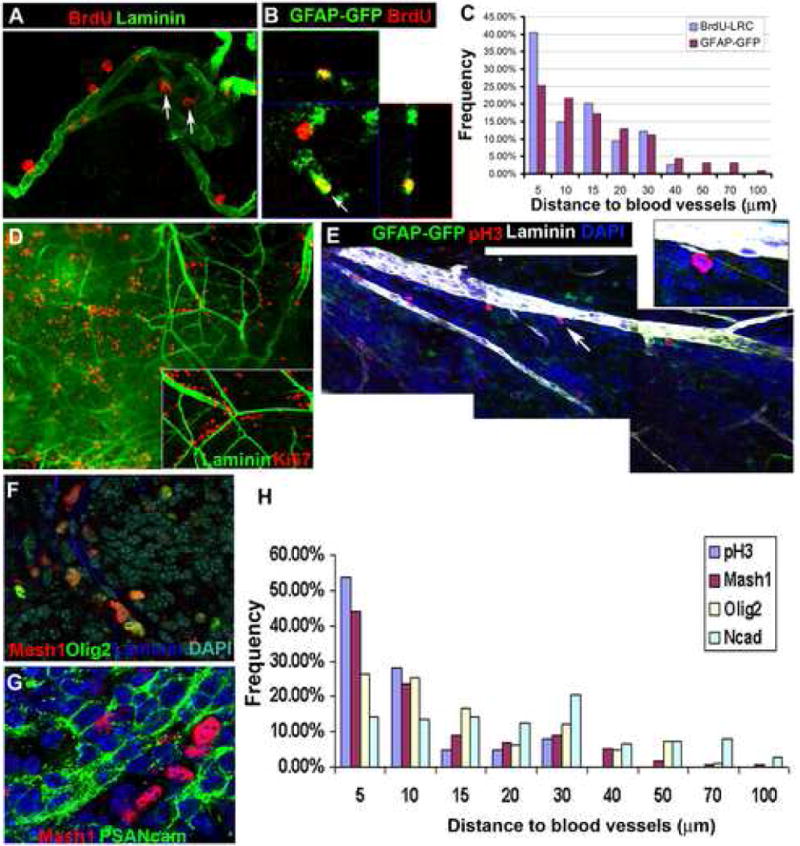
(A-C). Adult mice were given 5 daily BrdU injections then a 24 day chase to reveal LRCs.
(A). A confocal image of the SVZ showing BrdU LRC (red) proximity to blood vessel (Laminin+, green); some BrdU+ cells are in a niche formed by a knot of vessels (arrows).
(B). An orthogonal section of confocal z-stacks. Arrow: a BrdU-retaining cell (red) that is positive for GFAP-GFP. 25.0% of LRCs were found to be GFAP-GFP+ after GFP staining, similar to the 38% observed using a 6 week chase period (Tazavoie et al, 2008). The identity of GFAP-ve LRCs remains to be determined.
(C). Histogram of distance of LRCs and GFAP-GFP cells to vessels (Data from 13 images derived from 4 SVZ wholemounts).
(D). A low power image of an SVZ wholemount stained for the cell proliferation marker Ki67 (red) and Laminin (green). Ki67+ cells are frequently aligned next to blood vessels (arrow indicates the area shown inset in a higher magnification confocal image).
(E). A montage of single Z-sections of confocal images of a GFAP-GFP SVZ wholemount stained for pH3+ cells (red), Laminin (pseudocolored white), and DAPI (blue). PH3+ cells are adjacent to the vessels. Note one positive cell (arrow and inset) next to a Laminin+ fractone.
(F). Double-labeling of Mash1 (red) and Olig2 (green).
(G). Mash1+ cells (red) are near their lineal progeny PSA-NCAM+ Type A cells.
(H). A histogram of the distance to vessels of cells that are pH3+, Mash1+, Olig2+ and N-cadherin+. Most pH3+ cells are within 10 μm of the nearest vessel, Mash1+ cells are similarly close while Olig2+ cells are more widely distributed around the vessels. The distances of N-cadherin+ ependymal cells were plotted as a reference, and range from 5 μm-100 μm. Data pooled from 5 randomly chosen images.