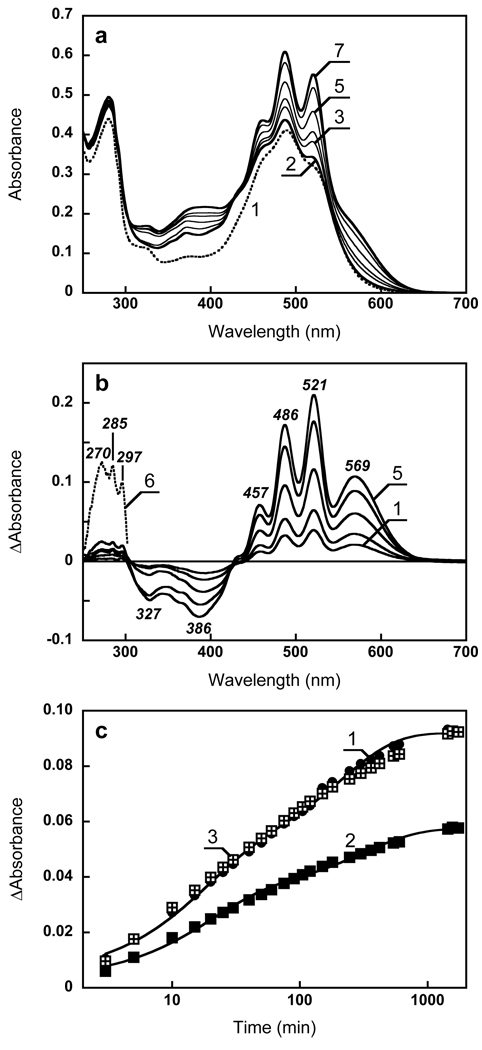
Figure 3.
Reconstitution of xanthorhodopsin with retinal. (a) Spectrum 1, absorption spectrum of Salinibacter ruber cell membrane containing xantho-opsin; spectrum 2, 1 min after addition of 2 µl ethanol solution of all-trans retinal, final concentration, 3 µM; spectra 3 through 7, subsequent measurements at 5, 10, 40, 300 and 1560 min after addition of retinal. (b) Spectra 1 through 5, difference spectra between spectra 3 to 7 and spectrum 2 in Fig. 3a. Spectrum 6, same as 5 but multiplied by 7 to show the UV bands. (c) Kinetics of absorption changes. Curve 1, 600 nm, curve 2, 521 minus 533 nm. Curve 3, same as 2 but normalized at the maximum (at 26 hours). Note that the time scale is logarithmic.

