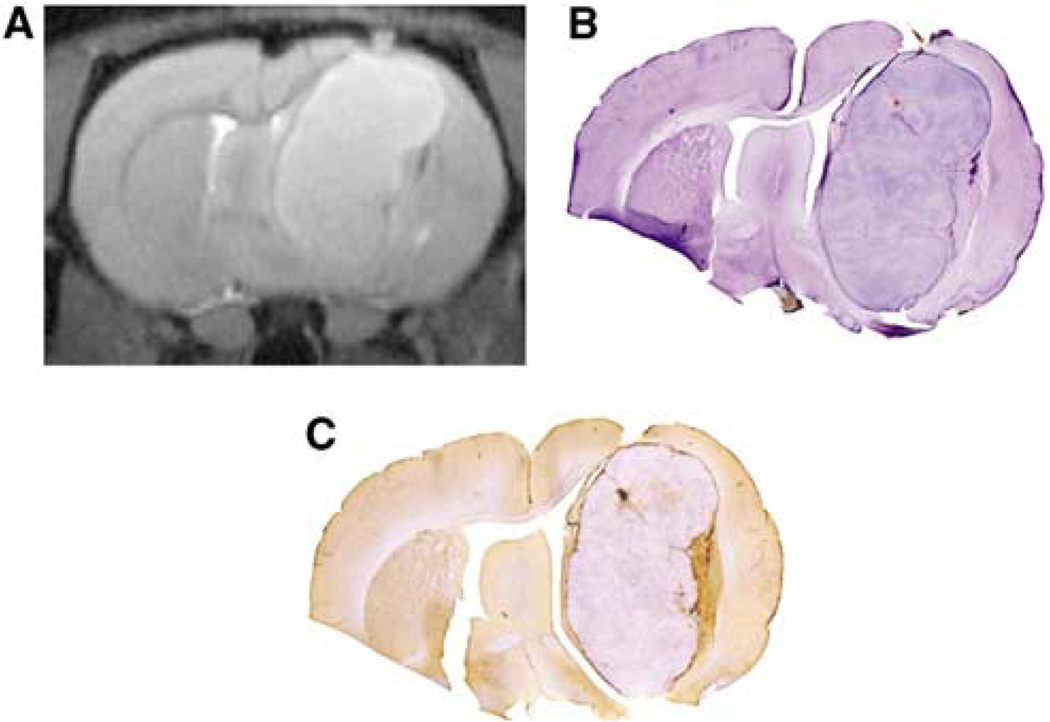
Figure 4.
Minimal ferumoxytol uptake in the rat U87 glioma xenographed model. (A) T2-weighted MR image delineates the hyperintense mass. (B) Hematoxylin-stained histological section shows matched tumor volume. (C) On the Perl’s iron-stained section, there is only a minimal ferumoxytol uptake in the tumor tissue, with most iron staining found at the tumor periphery as evidenced by brown staining.

