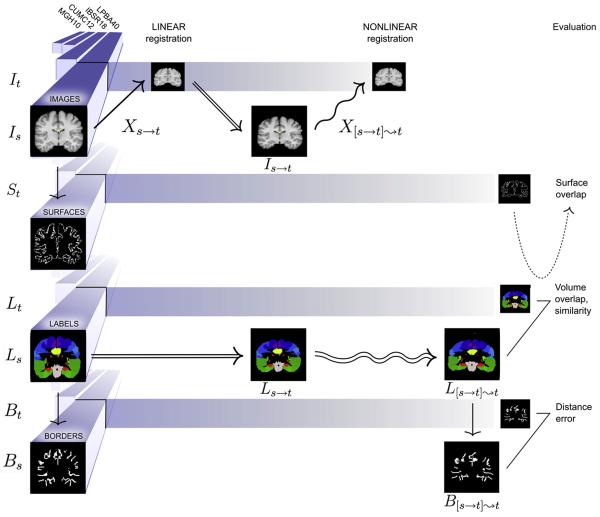
Fig. 3.
Overview. This diagram provides an overview of the study for a single nonlinear registration algorithm, placing example preprocessed data from Fig. 1 into the equations of Fig. 2. The three stages include linear registration, nonlinear registration, and evaluation (left to right). The four different datasets (LBPA40, IBSR18, CUMC12, and MGH10) are aligned along the left in four different versions: images, surfaces derived from the images, labels, and borders derived from the labels. A source and target are drawn from each version (image volumes are shown as coronal slices for clarity). A source image Is is linearly then nonlinearly registered to a target image It. The linear and nonlinear transforms (Xs→t and X[s→t]⇝t) are applied to the corresponding source labels Ls. The resulting nonlinearly transformed labels L[s→t]⇝t are compared against the target labels Lt. This comparison is used to calculate volume overlap and volume similarity per region. The target surface St is intersected with the target labels Lt and warped source labels L[s→t]⇝t to calculate surface overlap. Borders between each labeled region and all adjacent labeled regions are constructed from Lt and L[s→t]⇝t, and average distances between the resulting borders Bt and B[s→t]⇝t are calculated per region.

