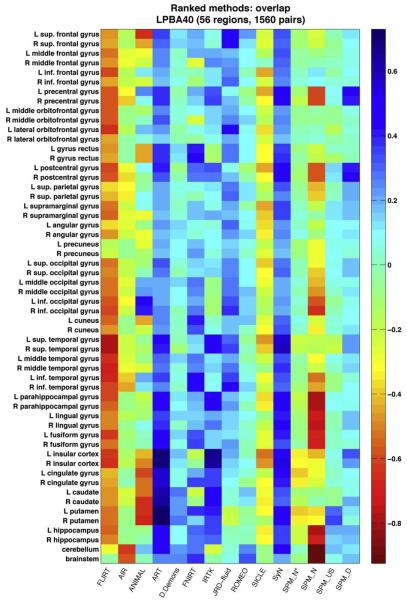
Fig. 7.
Indifference-zone ranking of the registration methods: LPBA40 overlaps. This matrix uses a color scale that reflects the relative performance of the registration methods (with blue indicating higher accuracy). Each colored rectangle represents the average score for a given method for a given region, averaged over 1,560 LPBA40 registrations. The scores are {−1,0,1} values indicating the pairwise performance of the method relative to each of the other methods (see text), according to target volume overlap (union and mean overlap results are almost identical). The colors (and color range) are not comparable to those of the other label sets (Figs. 8, 9, and 10 in Supplementary section 3). (SPM_N*=“SPM2-type” Normalize, SPM_N=Normalize, SPM_US=Unified Segmentation, SPM_D=DARTEL pairwise).

