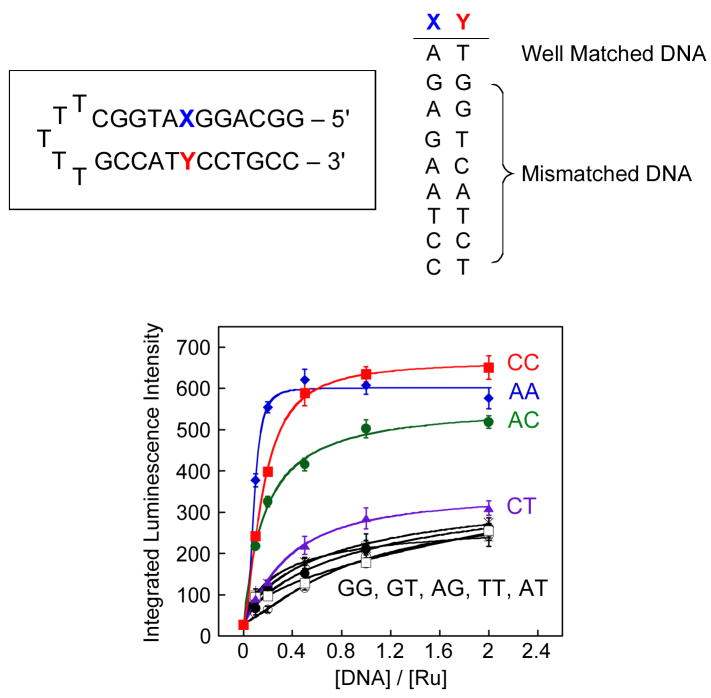
Figure 4.
Titrations of Ru(bpy)2dppz2+ with hairpin DNAs containing different mismatches. Top: Hairpin DNA sequences. Bottom: plots of the integrated emission intensity (λex = 440 nm) of Δ–Ru (100 nM) with with increasing concentrations of hairpin DNA containing mismatches: GG (○), GT (□), AT (●), AG (×), TT (+), CT ( ), AC (
 ), AA (
 ), and CC (
 ) in 50 mM NaCl, 5 mM Tris, pH 7.5. Error bars indicate standard deviations in the measurements.

