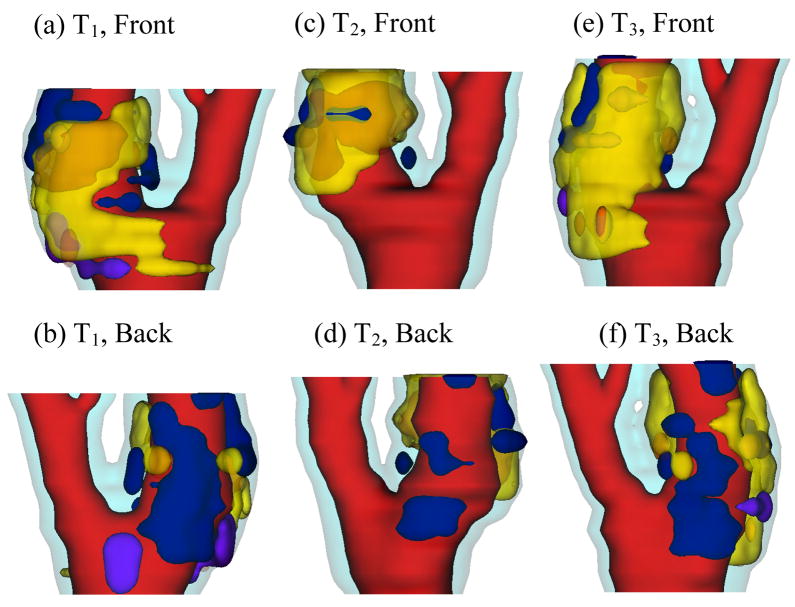
Figure 2.
Re-constructed 3D geometry of a carotid plaque based on in vivo serial MRI data. Three time point data are shown. T1, T2 and T3 refer to time points from here on, unless otherwise indicated. T1–T2: 525 days; T2–T3: 651 days. Red – lumen; Cyan- outer wall; Yellow - necrotic core; Fresh red - hemorrhage in necrotic core); Purple - loose matrix; Dark blue – calcification; Green - fibrous cap.

