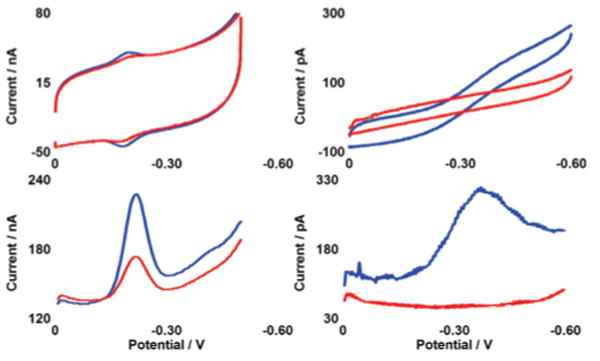
Figure 2.

CV (top) and SWV (bottom) of NB–DNA at macroelectrodes of 2 mm diameter (left) and microelectrodes of 25 μm diameter (right). Voltammetry without TBP (blue) and with 300 nM TBP (red) is shown at pH 7 in a degassed phosphate buffer containing 5 mM NaPi, 50 mM NaCl, 4 mM MgCl2, 4 mM spermidine, 50 μM EDTA, 10% glycerol. After addition of protein, solutions were briefly stirred by a gentle argon purge. The sequence is thiol-5′-GAGATATAAAGCACGCA-3′ plus NB-modified complement. The potentials are reported versus Ag/AgCl with a CV scan rate of 50 mV/s and an SWV frequency of 15 Hz.
