
Figure 3.
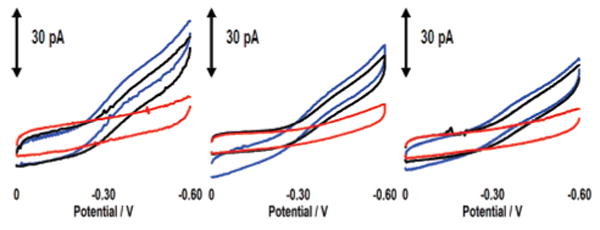
CV of three NB–DNA modified microelectrodes (10 μm) before and after addition of proteins. CVs before protein addition are in blue. From left to right, the black CVs represent addition of BSA (2 μM); BSA (1 μM) + EndoIII (1 μM); and BSA (1 μM) + BAM (1 μM). CVs in red reflect the subsequent addition of 30 nM TBP to each electrode. The data have been smoothed for clarity. The sequence is thiol-5′-GAGATATAAAGCACGCA-3′ plus NB-modified complement, and the potentials are reported versus Ag/AgCl with a CV scan rate of 50 mV/s.