
Figure 3.
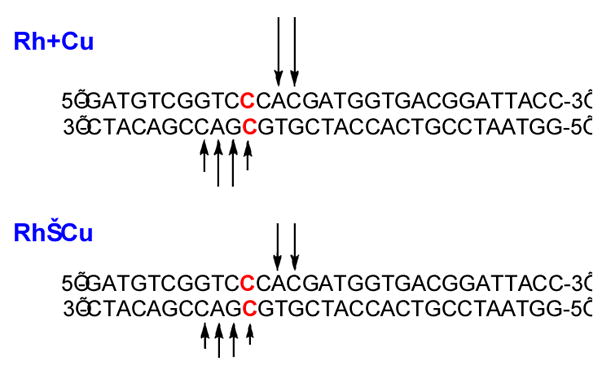
Representation of DNA cleavage sites by Rh+Cu (top) and Rh−Cu (bottom). The arrows indicate the cleavage sites on the 5′-32P-end-labeled strands. The length of each arrow at the given site reflects the relative percent cleavage on the strand. The mismatched site is highlighted in red.