
Figure 2.
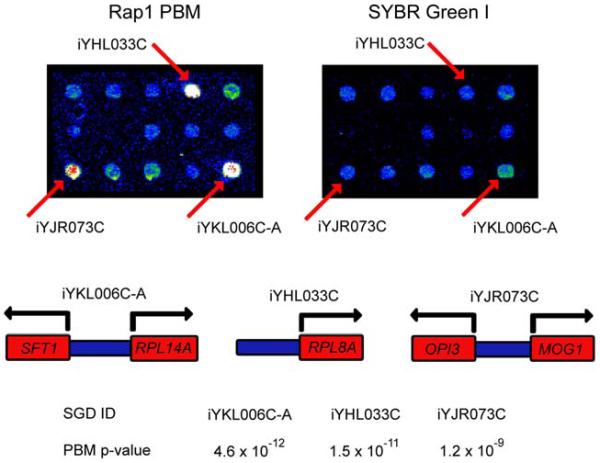
Magnification of identical portions of a yeast intergenic microarrays used in a PBM experiment (left panel) or stained with SYBR Green I (right panel). Fluorescence intensities are shown in false color, with white indicating saturated signal intensity, red indicating high signal intensity, yellow and green indicating moderate signal intensity, and blue indicating low signal intensity. The three labeled spots correspond to the intergenic regions depicted below, along with the P-values derived from triplicate PBM and SYBR Green I microarray data. (Reproduced from (Mukherjee et al., 2004) with permission from Nature Publishing Group.)