
Figure 4.
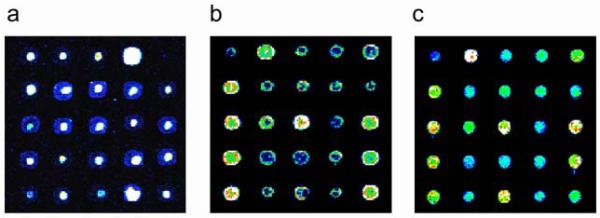
Examples of DNA microarray spot quality. Identical portions of yeast intergenic microarrays printed onto Corning® GAPS II slides, processed in different ways (see below) before UV-crosslinking, and then stained with SYBR Green I. Images have been false-colored as in Figure 2. Examples of microarrays with poor spot quality are shown in (a) and (b). In both of these cases, the DNA is distributed non-uniformly, with either (a) high concentrations near the centers of spots, or (b) high concentrations along spot perimeters. Both of these microarrays resulted from two separate print runs, from which microarrays were UV-crosslinked without first rehydrating and baking. An example of a microarray of acceptable quality is shown in (c). This microarray was rehydrated and then baked before being UV-crosslinked. (Reproduced from (Berger and Bulyk, in press) with permission from The Humana Press, Inc.)