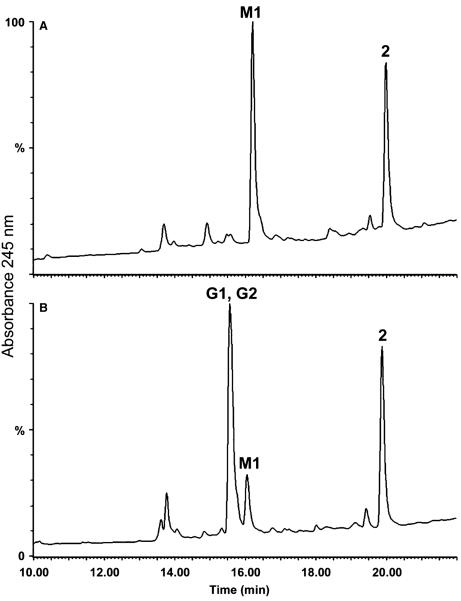
Figure 3.
HPLC chromatogram of compound 2 following (A) incubation with rat liver microsomes and (B) incubation with rat liver microsomes in the presence of reduced glutathione. HPLC conditions: YMC 5 μm basic 4.6 mm i.d. × 15 cm column, 1 mL/min, UV detection at 245 nm, 5-min 90% A/10% B, 20-min linear gradient to 10% A/90% B, 5-min 10% A/90% B (A = 0.1% TFA/water, B = 0.1% TFA/acetonitrile).

