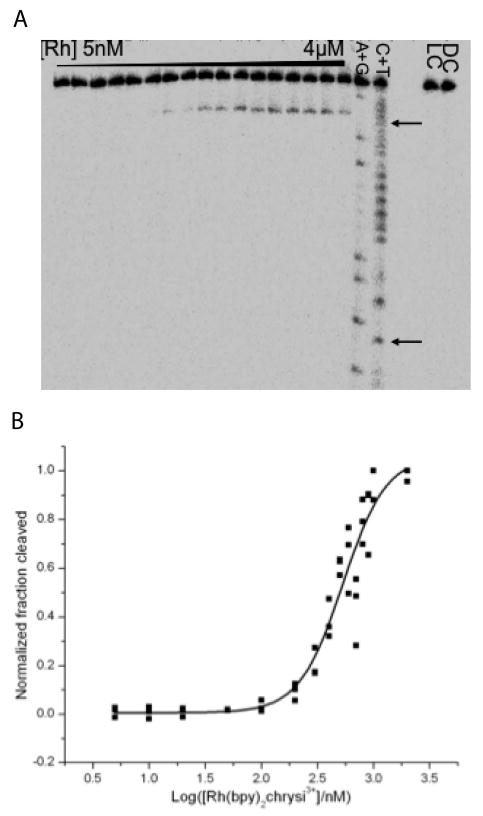
Figure 2.

Binding affinities determined through DNA photocleavage. The DNA hairpin sequence is 5′-GGCAGGXATGGCTTTTTGCCATCCCTGCC-3′ (X = C or A, underline denotes the mismatch). Samples were irradiated and electrophoresed through a 20% denaturing PAGE gel. A light control (LC, without rhodium) and dark control (DC, without irradiation) were included. A representative autoradiogram of a photocleavage titration with rac-Rh(bpy)2chrysi3+ (A, arrows indicate positions of mismatched bases) and a representative sigmoidal curve fit of pooled data from photocleavage titrations for binding constant determination (B) are shown.
