
Figure 4.
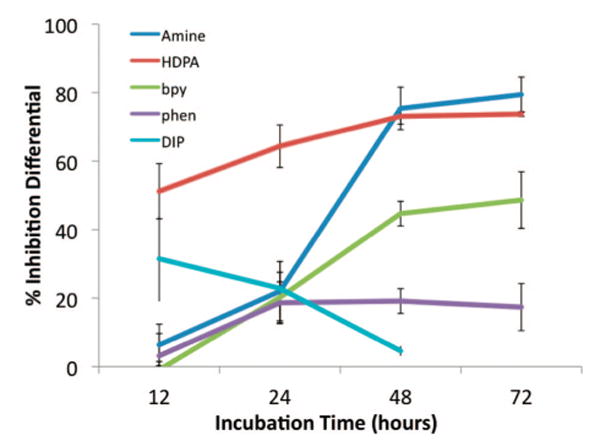
Inhibitory effects of rhodium metalloinsertors as a function of incubation time. Shown are plots of BrdU incorporation normalized to the BrdU incorporation of untreated cells as a function of rhodium concentration. The inhibition differential is the difference of the normalized percentages of cellular proliferation for each cell line, with standard error bars (SN–O = √(SN2 + SO2)). ELISA analyses were performed as in Figure 3. Cells were incubated with no rhodium, 2 μM rac-Rh(DIP)2chrysi3+, 10 μM Rh(NH3)4chrysi3+, or 20 μM rac-Rh(L)2chrysi3+ (L = HDPA, bpy, or phen).