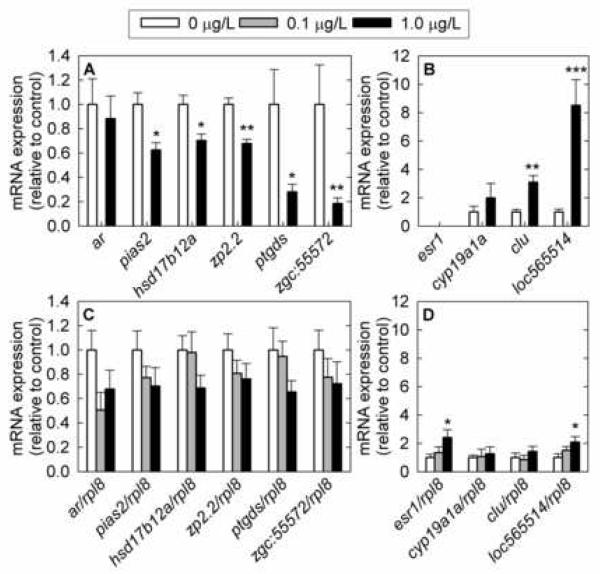
Fig. 2.
Cross-validation of gene expression changes in selected genes measured by microarray (A, B) and validated in a larger set of samples by Q-PCR (C, D) in female fathead minnow gonads following exposure to 17β-trenbolone for 4 days. A) Microarray data for downregulated genes. B) Microarray data for upregulated genes. C) Q-PCR data for downregulated genes. D) Q-PCR data for upregulated genes. ar: androgen receptor; pias2: protein inhibitor of activated STAT, 2; hsd17b12a: hydroxysteroid (17β) dehydrogenase 12a; zp2.2: zona pellucida glycoprotein 2.2; ptgds: prostaglandin D2 synthase; zgc:55572: similar to zebrafish zgc:55572 (homologous to human serine/threonine kinase 38); esr1: estrogen receptor 1; cyp19a1a: cytochrome P450, family 19, subfamily A, polypeptide 1a; clu: clusterin; loc565514: similar to zebrafish hypothetical protein LOC565514; rpl8: ribosomal protein L8. The Q-PCR data are normalized to rpl8 expression and the array data by residuals. For microarray analysis, n=4 fish; for Q-PCR analysis, n=10 fish (4 fish measured by microarray and 6 additional fish exposed in the same experiment) at doses 0 μg/L and 1 μg/L; n=6 fish at dose 0.1 μg/L. Error bars denote the standard error of the mean. Statistically significant differences in the expression levels of fathead minnow genes between control and treated fish are denoted by stars (* P < 0.05; ** P < 0.01; *** P < 0.001).

