Fig. 3.
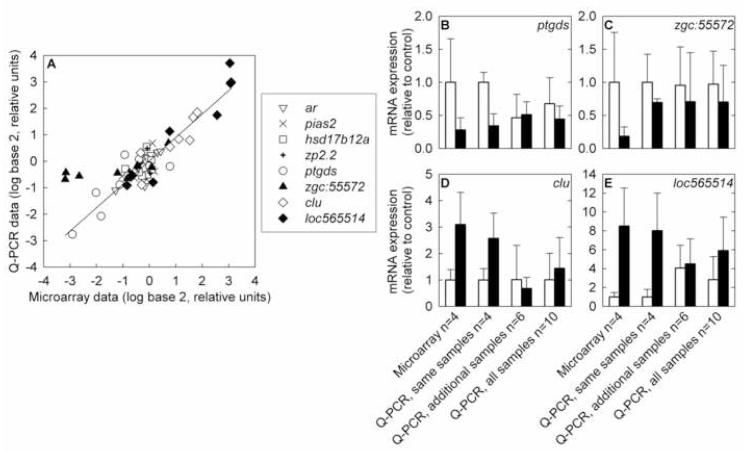
Comparison of gene expression measurements by microarray and Q-PCR. A) Correlation of microarray results with Q-PCR results from the same RNA samples. Data for each gene is expressed relative to the average of the untreated samples for that gene. ar: androgen receptor; pias2: protein inhibitor of activated STAT, 2; hsd17b12a: hydroxysteroid (17β) dehydrogenase 12a ; zp2.2: zona pellucida glycoprotein 2.2; ptgds: prostaglandin D2 synthase; zgc:55572: similar to zebrafish zgc:55572; clu: clusterin; loc565514: similar to zebrafish hypothetical protein LOC565514. The regression line shown is for the entire data set, excluding zgc:55572 (R2 = 0.84, slope = 0.88, intercept = 0.016). If zgc:55572 is included, the regression parameters are R2 = 0.71, slope = 0.70, intercept = 0.094. B-E) Comparisons of microarray results with Q-PCR results from the same samples, samples of additional fish from the same exposure tanks, and all samples. White bars represent the control group and black bars represent the 1 μg/L 17β-trenbolone treatment group. Error bars denote one standard deviation. B) prostaglandin D2 synthase, C) similar to zebrafish zgc:55572, D) clusterin, E) similar to zebrafish hypothetical protein LOC565514.

