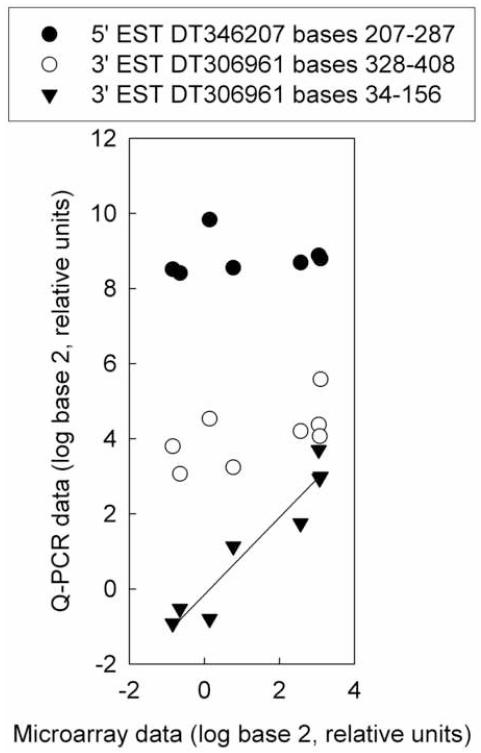
Fig. 4.
Position effects shown by three Q-PCR primer sets for hypothetical protein LOC565514 (loc565514). The microarray probe targeted bases 101-160 of 3′ EST DT306961. Q-PCR data was normalized to the abundance of ribosomal protein L8 (rpl8). Microarray data are expressed relative to the average of the untreated samples. Q-PCR data for all three primer sets are expressed relative to the average of the 3′ EST DT306961 bases 34-156 primer set for the untreated samples. Regression analysis did not show significant relationships for primer sets 5′ EST DT346207 bases 207-287 or 3′ EST DT306961 bases 328-408. The regression parameters for primer set 3’ EST DT306961 bases 34-156 are R2 = 0.96, slope = 1.0, intercept = -0.15.

