
Figure 3. Dose dependence of the Cd-induced increase in Kim-1 excretion.
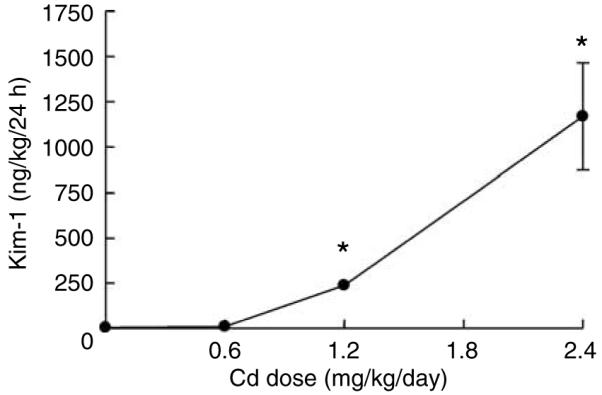
Animals were treated with varying doses of Cd (0, 0.6, 1.2, or 2.4 mg/kg/5 days per week for 4 weeks) and urine was analyzed for levels of Kim-1 as described in the Materials and Methods section. The results represent the mean±s.e.m. of six replicate samples for each treatment group. An * denotes significant differences from control values (P<0.05) as determined by the non-parametric Kruskal-Wallis test and Dunn’s post hoc test.