
Figure 5. Real time RT-PCR analysis of Kim-1 expression.
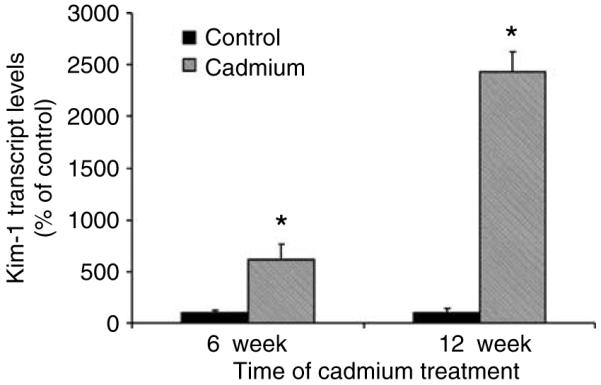
Total RNA was isolated from the renal cortex and subjected to real time RT-PCR analysis as described in the Materials and Methods section (n=4 for the 6-week controls and 6 for all other treatment groups). An * denotes significant differences from week matched control values as determined by two-tailed t-tests (P<0.05).