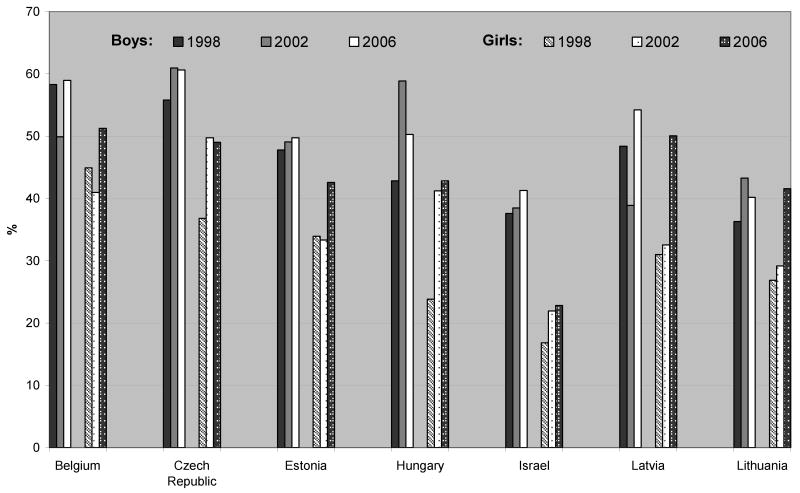
Figure 1.
Monthly alcohol use for boys and girls, for countries where use increased among girls but did not change among boys, HBSC 1998, 2002, 2006*
*Note: Three other countries with a different pattern are not displayed: UK (boys increase their alcohol use while girls don't experience a change) and Ireland and Norway (boys decrease their alcohol use while girls don't experience a change).

