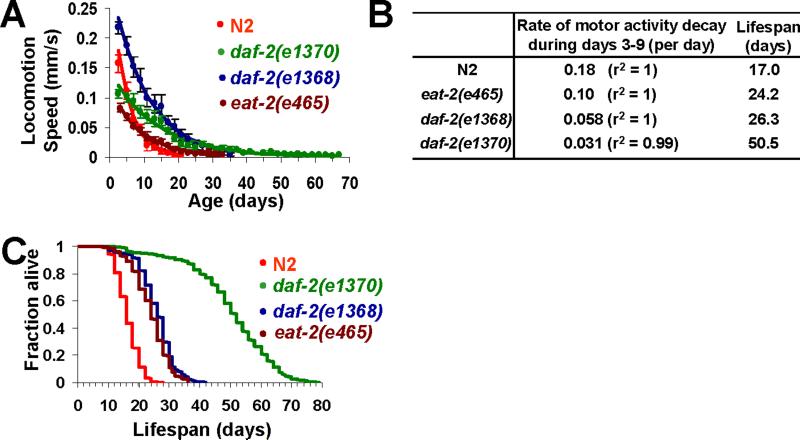
Figure 3. Mutant strains with deficits in insulin signaling and food intake reduce the rate of motor activity decline.
(A-B) The rate of locomotion speed decay is reduced in daf-2 and eat-2 mutant worms. Locomotion speed of wild-type (N2), daf-2 and eat-2 mutants was plotted as a function of age beginning day 3 (A), and the rate of locomotion speed decay in each strain was calculated and shown in (B). n≥30. Censored worms were not included for analysis. The mean lifespan of each strain was also shown in (B). Error bars represent SD.
(C) Lifespan curve (Kaplan–Meier test) of daf-2(e1370) [mean lifespan: 50.5 ± 0.8 (SEM) days; 75% lifespan: 60 days], daf-2(e1368) [mean lifespan: 26.3 ± 0.4 (SEM) days; 75% lifespan: 30 days], eat-2(e465) worms [mean lifespan: 24.2 ± 0.3 (SEM) days; 75% lifespan: 28 days], and N2 worms [mean lifespan: 17.0 ± 0.2 (SEM) days; 75% lifespan: 20 days] assayed in (A-B).

