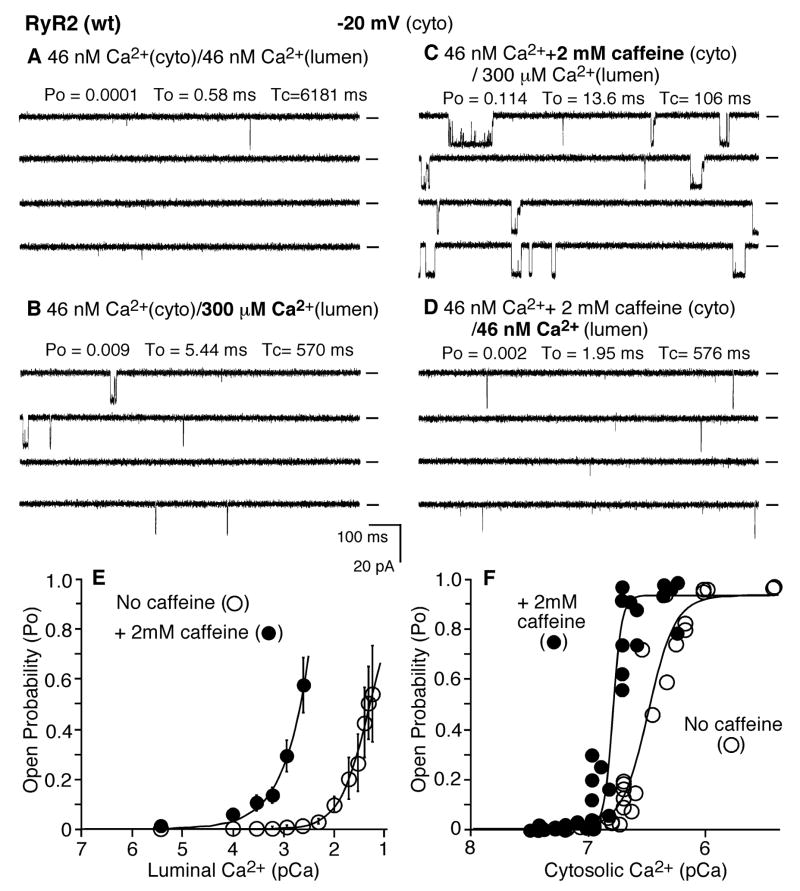
Fig. 3. Caffeine enhances the response of single RyR2 channels to luminal Ca2+ activation.
Single-channel activities of RyR2 were recorded in a symmetrical recording solution containing 250 mM KCl and 25mM HEPES (pH 7.4) at a holding potential of −20 mV. EGTA was added to either the cis or trans chamber to determine the orientation of the incorporated channel. The side of the channel to which an addition of EGTA inhibited the activity of the incorporated channel presumably corresponds to the cytosolic face. The Ca2+ concentration on both the cytosolic and luminal sides of the incorporated channel was first adjusted to ~46 nM (A). The channel was activated by 300 μM luminal Ca2+ (B). Caffeine was then added to the cytosolic side of the channel in the presence of 300 μM luminal Ca2+ (C), followed by a decrease of luminal Ca2+ to ~46 nM (D). Openings are downward. Open probability (Po), arithmetic mean open time (To), and arithmetic mean closed time (Tc) are indicated at the top of each panel. A short line to the right of each current trace indicates the baseline. A continuous recording is shown. The average recording time for each condition shown in panels A–D from 4 channels is 103 s. The relationship between Po and luminal Ca2+ concentration is shown in E, and the relationship between Po and cytosolic Ca2+ concentration is shown in F. Data points shown in E are means ± SEM from 5 RyR2 channels in the presence of 2 mM caffeine (solid circles) and 8 RyR2 channels in the absence of caffeine (open circles), and those shown in F are individual measurements obtained from 7 RyR2 channels in the presence of 2 mM caffeine (solid circles) and 5 RyR2 channels in the absence of caffeine. The average recording time is 107 s for E and 93 s for F.

