
FIGURE 3.
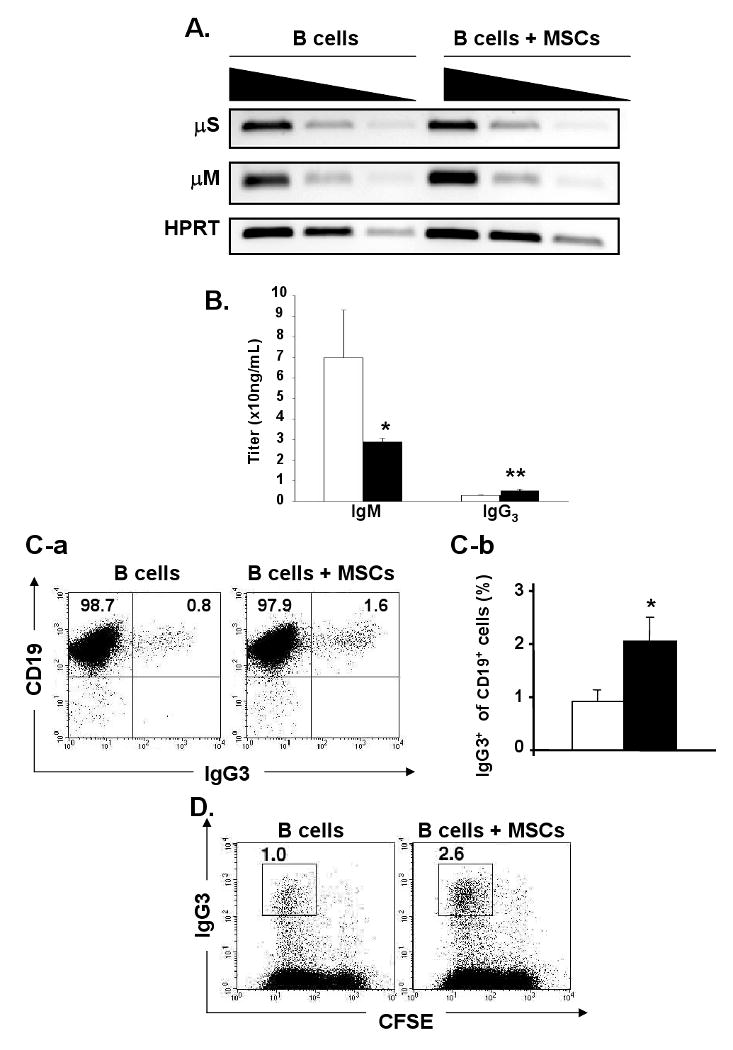
MSCs selectively suppress LPS-stimulated B cell differentiation into IgM-forming cells and augment IgG3 expression: (A) mRNA was extracted on day 3 from the B cells cultured with or without MSCs. The expression of μM and μS mRNA was analyzed by semi-quantitative RT-PCR. Four-fold dilution series of the cDNA were used as input material for the PCR with primers specific for μM, μS, or HPRT as a reference and HPRT mRNA as an internal control for the amount of mRNAs (representative of n=2); (B) Titers of IgM and IgG3 were measured by ELISA in the supernatant of B cells cultured alone (open bar) or co-cultured with MSCs (solid bar) for 3 days. (Titers are shown by mean ± SD, n=3; *, p < 0.05; **, p < 0.01); (C) MSCs and CFSE-labeled B cells (1: 10 ratio) were co-cultured in the presence of LPS. (C-a) The numbers indicate IgG3-CD19+ and IgG3+CD19+ fractions on day 3; (C-b) The percentage of surface IgG3+ cells in CD19+ cells in B cells cultured alone (open bar) or with MSCs (solid bar) (n=5; **, p < 0.01); (D) The percentages of CFSE-CD138+ cells were determined on day 3 by FACS and shown in each square (representative of n=5).