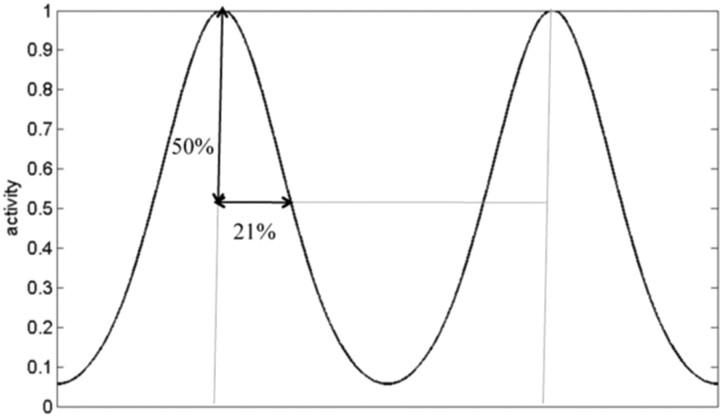
Figure 2.
Firing rate as a function of distance between the vertices of grid cells. We used Equation 1 to define this spatial decay of activity from the vertices (maximum activity) and matched this decay to that measured in (Leutgeb et al., 2007) (values here are normalized to the intervertex distance). Firing rate falls to 50% at a distance that is 21% of the intervertex distance. This condition is met for a = 0.3. At the half point between vertices there is ∼8% activity; the true minima is even lower, but not located along this line.

