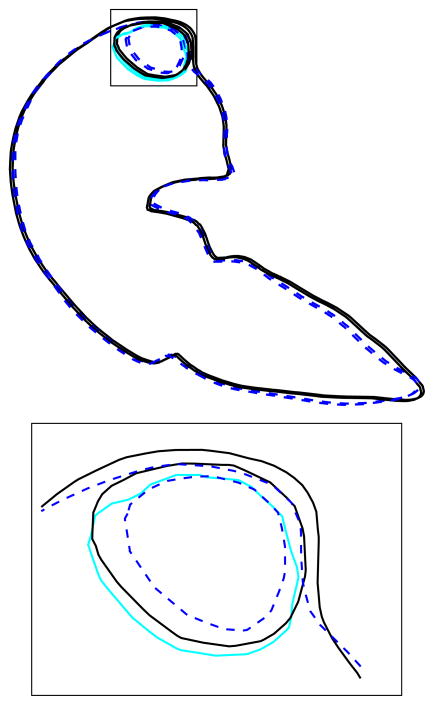
Fig. 12.
Cross-section FEM deformation result with enlarged detail: dark solid lines represents the pre-treatment, dotted lines represents post-treatment, and light gray (blue) the deformed pre-treatment tumor. A 3D view of the detail is presented in Fig. 11

