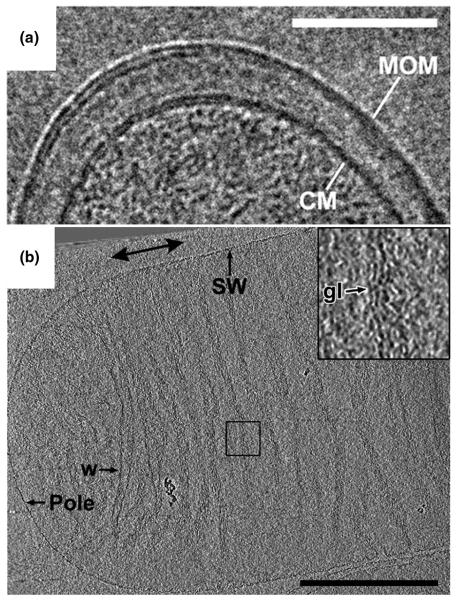
Figure 2. Cell envelope.
(A) Vitreous cryo-section of a Mycobacterium bovis BCG cell. The section has a nominal thickness of 35 nm. Scale bar 100 nm. Adapted from [12] with permission. © 2008 by The National Academy of Sciences of the USA. (B) 10-nm tomographic slice through an E. coli sacculus. The individual glycan strand densities lie in the plane of the sacculus, roughly perpendicular to the saccular long axis. Scale bar 500 nm. Adapted from [22] with permission. © 2008 by The National Academy of Sciences of the USA.

