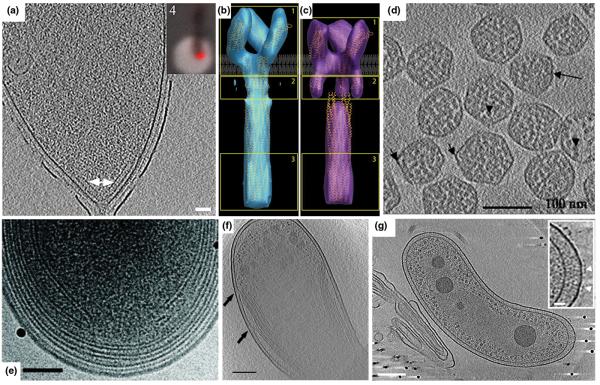
Figure 4. Intracellular structures.
(A) 15-nm tomographic slice of a C. crescentus cell showing a polar chemoreceptor array (arrow). Inset: fluorescence light microscopy image of the same cell showing the co-localization of McpA-mCherry with the polar array seen by ECT. Scale bar 50 nm. Adapted from [9] with permission from Blackwell Publishing Ltd. (B, C) ‘Compact’ (B) and ‘Expanded’ (C) conformations of the E. coli chemoreceptor Tsr visualized by ECT and sub-volume averaging. Adapted from [32] with permission. © 2008 by The National Academy of Sciences of the USA. (D) 4-nm tomographic slice of isolated Halothiobacillus neapolitanus carboxysomes. Scale bar 100 nm. Adapted from [34] with permission from Elsevier Ltd. (E) Tomographic slice of a Prochlorococcus MIT9313 cell showing the intracytoplasmic membrane. Scale bar 100 nm. Adapted from [36] with permission from the American Society of Microbiology. (F) 20-nm tomographic slice of a Rhodopseudomonas viridis cell exhibiting photosynthetic membranes. Scale bar 200 nm. Adapted from [37] with permission from Elsevier Ltd. (G) 8-nm slice of a Bdellovibrio bacteriovorus cell exhibiting a distinct nucleoid region. Scale bar 150 nm. Inset scale bar 25 nm. Adapted from [19] with permission from the American Society of Microbiology.

