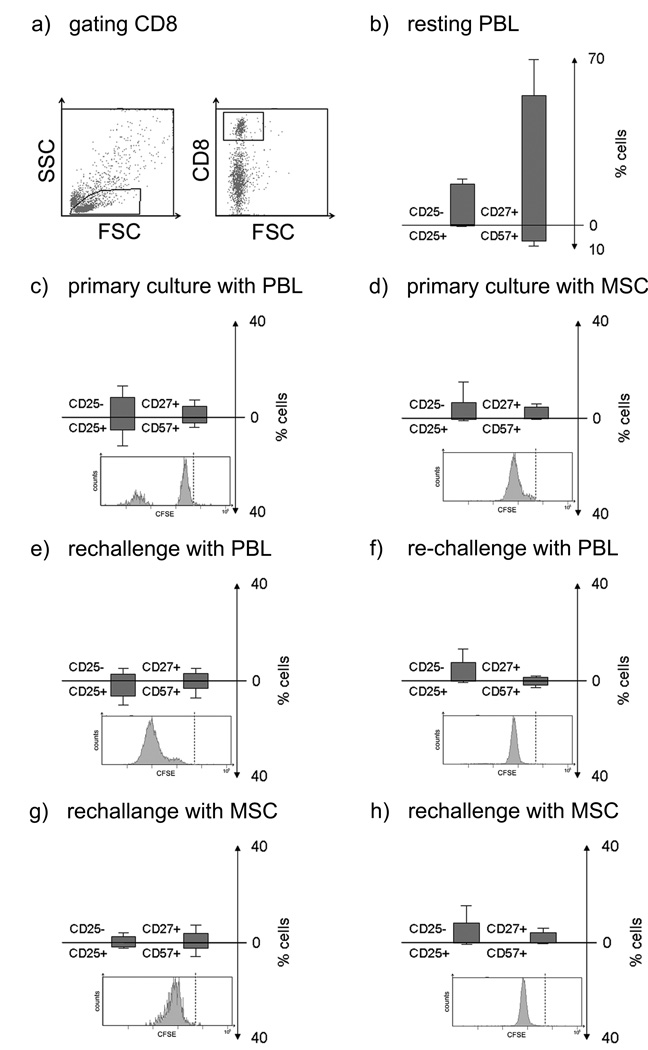
Figure 4.
Flow cytometric analysis of CD8+ lymphocytes primed with PBL or MSC and rechallenged with either MSC or PBL. In primary cultures responder PBL were cultured with PBL (ratio 1:1) or MSC (ratio 10:1) for 6 days (top panel). For rechallenge, responder cells were recovered and stimulated with PBL or MSC from the original stimulator for 3 days (bottom two panels). Each panel shows the proliferation as histogram of CFSE labelled cells (the broken line indicates CFSE level for resting cells), and shows the percentages of CD25− versus CD25+ (activated) CD4+ cells, CD27+/CD57− (memory/naïve) versus CD57+/CD27− (effector) cells. (a) Representative dot plot with gating for CD8+ cells. (b) Levels in resting PBL. (c) PBL primed with PBL. (d) PBL primed with MSC. (e) PBL primed with PBL and rechallenged with PBL. (f) PBL primed with MSC rechallenged with PBL (g) PBL primed with PBL and rechallenged with MSC. (h) PBL primed with MSC and rechallenged with MSC. Figures represent mean ± SD of three experiments using stimulators and responders from different individuals.

