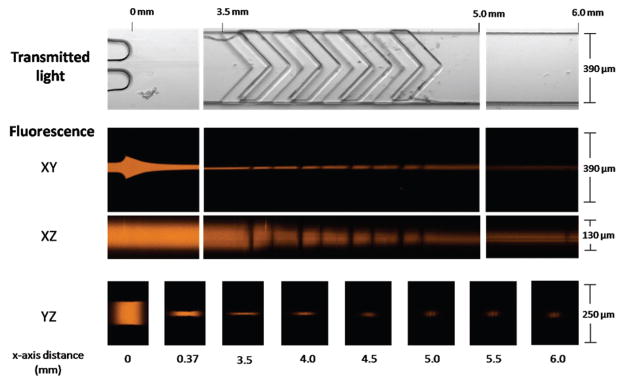
Figure 2.
Confocal microscopy images of the sheathing process of the microflow cytometer. The core, with fluorescent dye, is initially sandwiched and focused between two sheath streams (0–3.5 mm) at the sample inlet. Upon entry into the chevron structures (3.5–5.0 mm), the core height is dramatically reduced as the sheath fluid fully surrounds the core. Finally, a tight core stream enters the interrogation region (6.0 mm). The core is introduced at a flow rate of 10 μL/min, and the sheath flow rate is 400 μL/min.

